



The Lost Art of Reading Data in Food and Beverage Marketing (Not Looking at It)
The food and beverage industry has more data than ever before. Nielsen reports. Circana data. Shopify dashboards. Retail scanner data. Amazon analytics. Google Analytics. Meta campaign reports. Consumer panels. Loyalty data. Trade promotion reports. AI-generated summaries.
And yet I can’t help feeling we’re becoming worse at reading it…
Somewhere along the way, we stopped reading data and started looking at spreadsheets. They’re not the same thing.
Reading data in food and beverage marketing is an art. Not because it’s subjective or mystical, but because it requires interpretation, curiosity, context, and the ability to see relationships that aren’t immediately obvious. I worry that many brand managers, marketers, and even business leaders have forgotten this. Or perhaps they were never taught it in the first place.
Long before dashboards, AI summaries, and automated reports, I studied sociology. Looking back, one of the most valuable things I learned wasn’t sociology itself. It was how to think.
We weren’t taught to worship numbers. We were taught to question them. We learned to combine quantitative research with qualitative observation, statistical data with human behavior, surveys with fieldwork, and patterns with context. The numbers were never the conclusion. They were clues. That mindset has stayed with me throughout my career in food marketing and while building my own startup. It continues to shape how I approach every dashboard, report, and performance review.
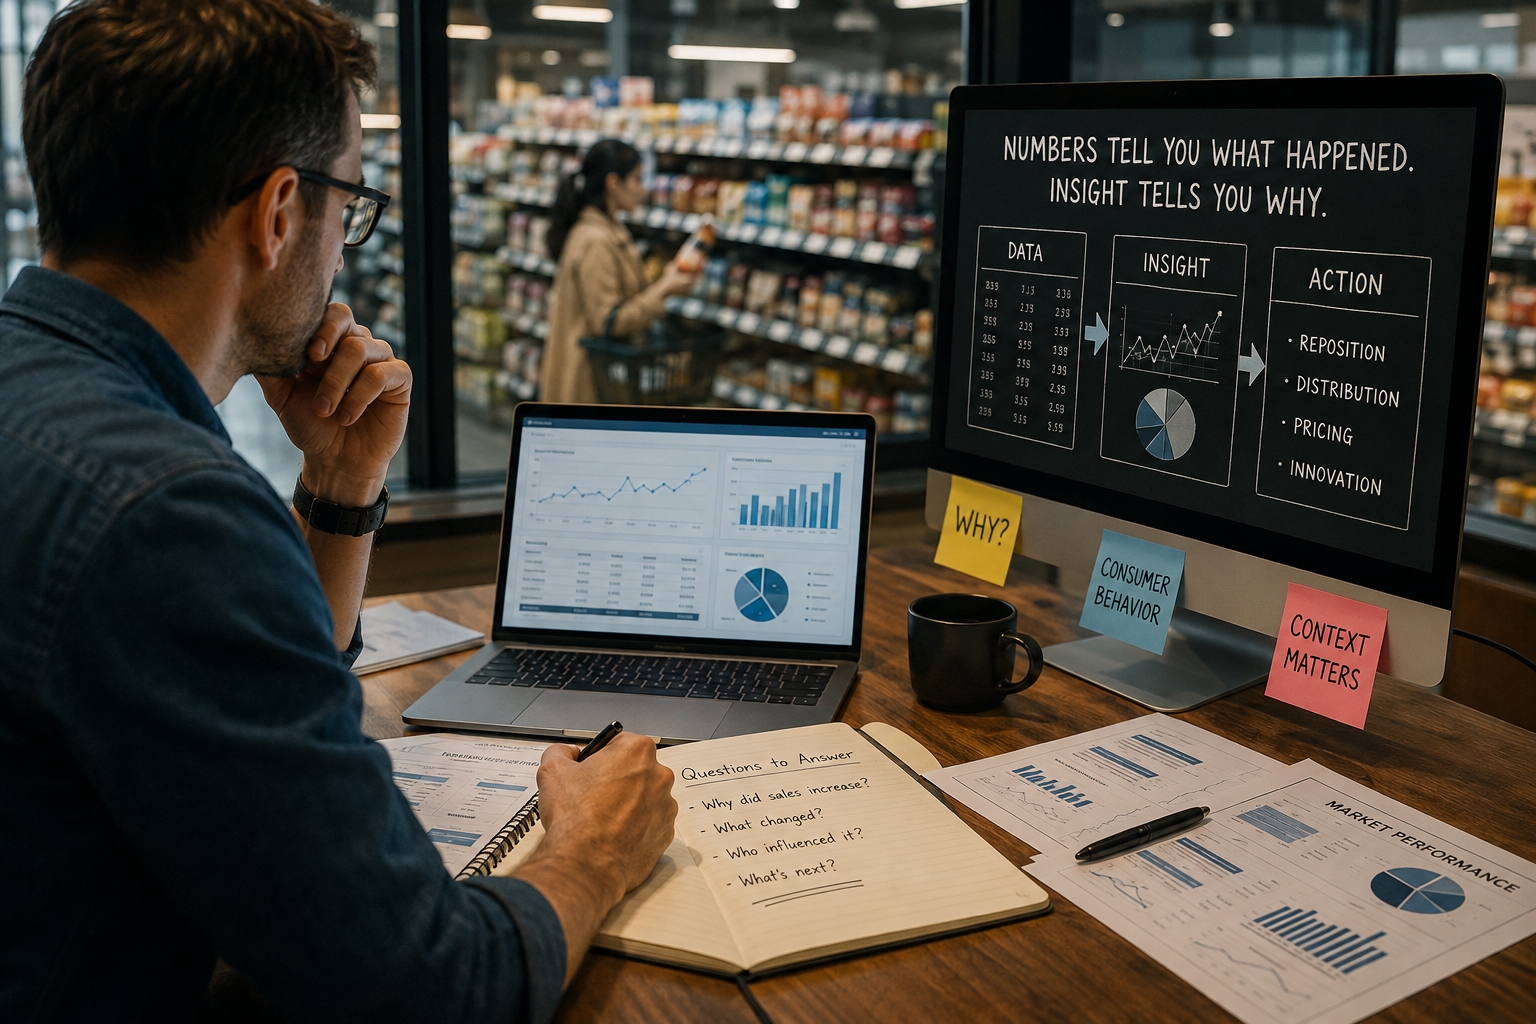
Ironically, as our access to data has exploded, it has become easier to mistake reporting for thinking. Too often, people stare at spreadsheets as though the answers are hidden somewhere inside the cells. They aren’t. A spreadsheet is simply the visible surface of a much larger story that is happening on the ground. The real work begins when you ask why those numbers exist in the first place and what invisible forces produced them.
This is one of the biggest misconceptions in marketing: the belief that data is objective. It isn’t. The numbers are objective. Their interpretation is not.
Two brand managers can look at the exact same Nielsen report, Shopify dashboard, Meta campaign results, Google Analytics, retailer POS data, consumer panels, and sales forecasts and walk away with completely different conclusions. One decides to reduce marketing because sales are declining. Another sees an opportunity to reposition the product, improve distribution, rethink pricing, or invest in innovation. They aren’t disagreeing about the data. They’re interpreting its meaning differently.
That’s because data tells us what happened. It rarely tells us why. Understanding the “why” requires more than staring at screens. It requires being engaged with the culture itself-being on the ground, watching how things actually unfold in physical reality, not from a studio or a situation room.
Imagine a food brand that reports a 15% increase in sales. On paper, that’s good news. But what actually caused the increase? Was the product added to new retailers? Did a grocery chain run a temporary promotion? Did a TikTok recipe suddenly make the product relevant? Did a major competitor go out of stock? Did weather shift purchasing behavior? Did repeat purchases improve? Or did a packaging redesign finally communicate the product’s value clearly enough for consumers to notice it?
The dashboard faithfully records the outcome, but it doesn’t explain the cause. That explanation requires judgment. This is a relatively straightforward example, but many times it’s much harder to decipher what’s behind the data.
And this is where most people get it wrong. They assume judgment comes from knowing the right software, mastering the right dashboards, or following the right analytical process. It doesn’t. Real judgment comes from somewhere else entirely-from experience, from cultural fluency, from having spent enough time on the ground watching how people actually shop, cook, choose, and abandon products. It comes from the ability to hold the numbers in one hand and lived reality in the other, and still see the connection between them.
The same is true of almost every business metric. A rise in Shopify conversion may look encouraging until you discover that average order value has fallen. A stronger Meta ROAS may simply reflect heavier discounting rather than better creative. Higher total sales can coincide with weaker retailer productivity if new distribution comes from lower-performing stores. Even market share gains tell different stories depending on whether the category itself is growing or shrinking.
Numbers never exist in isolation. They interact with pricing, distribution, competition, seasonality, retailer promotions, culture, consumer psychology, and countless other variables. Looking at any single KPI without understanding its context is like trying to understand a movie by looking at a single frame. This is what marketing data interpretation is really about-not collecting more numbers, but understanding what they actually mean.
This is also why strategy is fundamentally different from reporting. Dashboards describe the past. Strategy attempts to predict the future. Reading business data is much closer to the work of a detective than an accountant. You’re gathering evidence, testing hypotheses, eliminating false explanations, and trying to understand the underlying forces that produced the outcome you see on the screen.
Over the past several months, I’ve spoken with a number of food and beverage companies hiring Brand Managers. Almost every job description says they’re looking for someone who can “read the data,” “connect the dots,” and make data-driven decisions, but also think out of the box at the same time.
At first, I found that encouraging. I thought companies were finally recognizing that interpretation matters more than reporting.
But the deeper those conversations went, the more I realized many of them weren’t actually describing the skill they thought they were looking for. I think they were just using buzzwords rather than understanding their real meaning.
When they talked about “reading data,” the discussion almost always came back to dashboards, spreadsheets, KPIs, reporting systems, and software proficiency. In other words, they were describing someone who knows how to produce reports, not necessarily someone who knows how to interpret reality.
Those are two very different skills.
When I talk to bigger brands and ask them how they actually gather real-world data, whether they have anyone on the ground talking to consumers, they almost always conclude that they’re too big and don’t have the ability to do that. Which I think is the biggest lie, because in the age of the internet, there has never been an easier way to connect with consumers.
The best marketers I’ve worked with don’t impress me because they know the most KPIs. They impress me because they notice patterns other people overlook and aren’t afraid to go out into the world and ask real questions directly. They connect seemingly unrelated events. They recognize weak signals before they become obvious trends. They ask better questions than everyone else in the room:
- Why did velocities increase while household penetration declined?
- Why did promotions increase volume but hurt profitability?
- Why did Whole Foods outperform Kroger despite identical pricing?
- Why are repeat purchases falling even though Meta ROAS is improving?
- Why did Nielsen show category decline while our brand gained share?
- Why is Amazon growing while retail distribution is shrinking?
Ironically, this human ability will become even more valuable as AI improves. AI will become exceptional at organizing information, summarizing reports, identifying anomalies, generating visualizations, and finding patterns across enormous datasets. Those capabilities will save countless hours of manual work. But deciding which signal matters, which pattern is meaningful, and what action should follow still depends on judgment shaped by experience, curiosity, and an understanding of how people actually behave.
AI will further democratize access to data and information. Every company will have dashboards. Every company will have summaries. Every company will have predictive models. That means the competitive advantage will no longer come from having more data. It will come from having people who can read it wisely-people who see what everyone else misses and are not afraid to get out into the world and get their hands dirty. As AI becomes a standard tool, data interpretation in food and beverage marketing will become an even greater competitive advantage.
Perhaps that’s why my sociology education has remained surprisingly relevant throughout my career. It didn’t simply teach me how to analyze data. It taught me how to think about people, systems, incentives, and context before jumping to conclusions.
In an age where everyone has access to the same dashboards and increasingly the same AI tools, that ability may become one of the most valuable competitive advantages of all.
Because data doesn’t speak. Someone still has to interpret the story.
Reading data is becoming a lost art. And I suspect the people who master reading data in food and beverage marketing-who remain grounded in empirical reality and observation-will quietly outperform everyone still staring at spreadsheets.
The future belongs to those who notice what others overlook.